Measuring cooling tower efficiency calculation tells you exactly how well your tower removes heat, and where performance is being lost. At its core, efficiency depends on three variables: the hot water temperature entering the tower, the cold water temperature leaving it, and the wet-bulb temperature of the surrounding air.
The closer the cooled water gets to the wet-bulb temperature, the higher the efficiency. This guide walks you through every step of the calculation, explains the heat rejection formula, and shows you how to interpret your results.
What Is Cooling Tower Efficiency?
Cooling tower efficiency measures how effectively a tower removes heat from water compared to its theoretical maximum capacity. The higher the efficiency, the closer the cooled water temperature gets to the ambient wet-bulb temperature.
This metric matters across power plants, HVAC systems, and industrial cooling operations because it directly impacts energy consumption and process reliability. A tower operating at low efficiency forces chillers and associated equipment to work harder, driving up operational costs.
Key Terms Used in Cooling Tower Efficiency Calculation
Before running any calculation, you need to understand three foundational terms. Each one plays a specific role in the efficiency formula.
Cooling Tower Range
The cooling tower range measures the temperature drop the tower achieves. It is the difference between the hot water temperature entering the tower and the cold water temperature leaving it.
Formula:
Range = Hot Water Temperature − Cold Water Temperature
A higher range indicates greater heat removal, which generally signals strong thermal performance. Range is directly influenced by the heat load placed on the tower.
Cooling Tower Approach
Approach measures how close the cooled water temperature gets to the wet-bulb temperature of the surrounding air.
Formula:
Approach = Cold Water Temperature − Wet Bulb Temperature
A lower approach value means the tower is performing closer to its theoretical limit. Approach temperature is one of the most reliable indicators of cooling tower condition.
Wet Bulb Temperature
Wet-bulb temperature represents the lowest temperature achievable through evaporative cooling under current atmospheric conditions. It accounts for both air temperature and humidity, making it more meaningful than dry-bulb temperature for cooling tower analysis.
In thermal efficiency assessments, wet-bulb temperature serves as the benchmark. No evaporative cooling tower can cool water below the ambient wet-bulb temperature—this is a physical limit, not a design constraint.
Cooling Tower Efficiency Formula
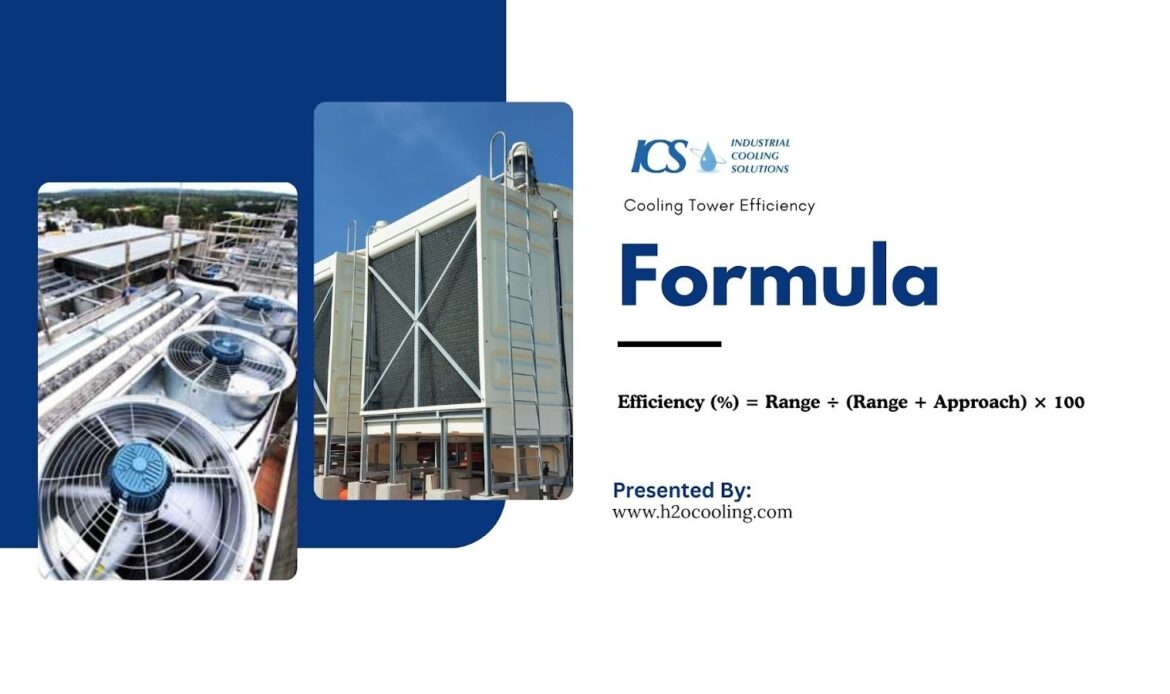
The standard cooling tower efficiency formula is:
Efficiency (%) = Range ÷ (Range + Approach) × 100
Written in full variable form:
Efficiency (%) = (Hot Water Temp − Cold Water Temp) ÷ (Hot Water Temp − Wet Bulb Temp) × 100
Here is what each variable represents:
- Hot Water Temperature — the inlet temperature of warm process water entering the tower
- Cold Water Temperature — the outlet temperature of water leaving the tower basin
- Wet Bulb Temperature — the ambient air's theoretical minimum cooling temperature
Most industrial cooling towers operate within a thermal efficiency range of 60–80%. Towers approaching or exceeding 80% are considered high performers, while results below 60% typically indicate maintenance or design issues that require attention.
Cooling Tower Efficiency Calculation Step by Step
Calculating cooling tower efficiency requires accurate temperature readings from three specific points in the system. Each measurement must be taken under stable operating conditions to produce reliable results.
Inaccurate readings—especially of wet-bulb temperature—can skew the final efficiency figure and lead to poor operational decisions. Follow each step carefully and document your values before applying the formula.
Step 1: Measure Hot Water Temperature
Measure the temperature of water at the inlet point where hot process water enters the top of the cooling tower.
Use a calibrated thermometer or an inline temperature sensor positioned directly in the flow path. This value represents the heat load entering the system.
Step 2: Measure Cold Water Temperature
Measure the temperature of water at the outlet, typically at the cold water basin located at the base of the tower. This reading reflects how much the tower has cooled the water.
Measure after the system has reached steady-state operation to avoid transient readings.
Step 3: Measure Wet Bulb Temperature
Wet-bulb temperature can be measured using several methods:
What tool gives you the most accurate wet-bulb reading on-site? That depends on your setup and the precision your application requires.
- Psychrometer: A sling or aspirating psychrometer measures both dry-bulb and wet-bulb temperature directly. It is one of the most reliable field instruments for this purpose.
- Weather station: On-site weather stations with humidity sensors can calculate wet-bulb temperature automatically.
- HVAC sensors: Many modern HVAC control systems include integrated sensors that report wet-bulb temperature in real time.
Always measure wet-bulb temperature at or near the tower air intake to get an accurate ambient reading.
Step 4: Calculate Cooling Tower Range
Apply the range formula:
Range = Hot Water Temperature − Cold Water Temperature
This value tells you how much heat the tower is actively removing from the water per cycle.
Step 5: Calculate Cooling Tower Approach
Apply the approach formula:
Approach = Cold Water Temperature − Wet Bulb Temperature
A smaller approach value indicates the tower is working closer to its maximum evaporative potential.
Step 6: Apply the Cooling Tower Efficiency Formula
With range and approach calculated, apply the performance formula:
Efficiency (%) = Range ÷ (Range + Approach) × 100
This final percentage tells you exactly how efficiently your cooling tower is operating relative to its theoretical maximum under current atmospheric conditions.
Example Cooling Tower Efficiency Calculation
The following example uses realistic field values to walk through a complete calculation.
| Parameter | Value |
| Hot Water Temperature | 95°F |
| Cold Water Temperature | 85°F |
| Wet Bulb Temperature | 78°F |
Step-by-step calculation:
- Range = 95 − 85 = 10°F
- Approach = 85 − 78 = 7°F
- Efficiency = 10 ÷ (10 + 7) × 100 = 10 ÷ 17 × 100 = 58.8%
A result of 58.8% falls slightly below the typical 60–80% range for industrial towers. This outcome suggests the tower may benefit from maintenance checks, airflow inspection, or fill media cleaning to restore optimal performance.
What Affects Cooling Tower Efficiency?
Cooling tower efficiency does not depend on one variable alone—it results from the interaction of multiple mechanical, environmental, and design factors. Understanding what drives performance loss helps operators prioritize corrective actions before efficiency drops significantly.
Here are the primary factors that influence how well a cooling tower performs:
Airflow Design
Airflow design determines how effectively air moves through the tower and contacts the water. Poorly designed airflow paths create dead zones where little evaporation occurs. Proper airflow design ensures full, even contact between air and water across the entire fill media surface, maximizing heat rejection.
Fan Placement
Fan placement directly affects how air enters and exits the tower. A fan positioned incorrectly can create turbulence, uneven air distribution, or short-circuiting. These issues reduce the volume of effective air-water contact and lower overall thermal efficiency.
Draft Type (Induced vs Forced Draft)
Induced draft towers draw air through the fill using a fan located at the top of the tower. This arrangement promotes even airflow distribution and reduces recirculation risks. Forced draft towers push air in from the bottom, which can create pressure imbalances and increase the likelihood of warm, moist exhaust air re-entering the inlet.
Air Recirculation
Air recirculation occurs when warm, moisture-laden exhaust air discharged from the tower re-enters the air intake instead of dispersing into the atmosphere.
This raises the effective wet-bulb temperature at the inlet, which increases the approach temperature and directly reduces cooling tower efficiency. Tower placement, wind direction, and discharge velocity all influence recirculation risk.
Thermal Performance of Fill Media
Fill media increases the surface area available for air-water contact inside the tower. Clean, undamaged fill allows water to spread into thin films, dramatically improving thermal efficiency through extended evaporation time.
Fouled, scaled, or broken fill media restricts water distribution, reduces evaporation, and lowers overall performance.
Typical Cooling Tower Efficiency Range
| Efficiency | Condition |
| 80%+ | Excellent performance |
| 70–80% | Normal industrial operation |
| 60–70% | Moderate efficiency |
| Below 60% | Maintenance or design issues |
These ranges serve as general benchmarks. Actual targets vary based on tower type, climate, and process requirements. Monitoring efficiency trends over time is more informative than comparing a single reading to a fixed benchmark.
How to Improve Cooling Tower Efficiency
Improving efficiency requires a structured approach that addresses both mechanical and operational variables. What specific steps can facility managers take to recover lost performance? The following actions have a direct impact on efficiency scores when implemented correctly:
- Optimize fan placement to ensure uniform airflow distribution across the fill media
- Improve airflow design by inspecting louvers, eliminating blockages, and verifying air velocity at the inlet and outlet
- Prevent air recirculation by assessing tower placement relative to wind patterns and nearby structures
- Maintain clean fill media through regular inspections, descaling, and replacement of damaged sections
- Monitor wet-bulb conditions continuously to adjust operational parameters during high-humidity periods
- Ensure proper water distribution by inspecting spray nozzles and distribution basins for clogging or uneven flow
Conclusion
Calculating cooling tower efficiency is a straightforward process with the right data. By measuring hot water, cold water, and wet-bulb temperatures, you can quickly determine your system's range, approach, and overall efficiency. The cooling tower performance formula—Efficiency (%) = Range ÷ (Range + Approach) × 100—provides a clear, actionable number to track.
Consistent monitoring helps you spot trends that signal potential issues like fouled fill or inefficient heat rejection, allowing for early intervention. A gradual drop in performance often precedes major failures.
This guide provides the framework for your cooling tower efficiency calculation, allowing you to benchmark your system and make targeted improvements. When efficiency falls, you'll know how to diagnose and fix the problem, preventing costly repairs and energy waste.
Ready to optimize your system's performance? Contact ICS today for an expert consultation and take control of your cooling tower's efficiency.
Frequently Asked Questions
What is the formula for cooling tower efficiency calculation?
The standard formula is: Efficiency (%) = Range ÷ (Range + Approach) × 100, where Range equals the hot water temperature minus the cold water temperature, and Approach equals the cold water temperature minus the wet-bulb temperature.
What is a good cooling tower efficiency?
A result of 70–80% is considered normal for industrial cooling towers. An efficiency above 80% indicates excellent performance. Results below 60% typically signal maintenance issues, fouled fill media, or airflow problems that require investigation.
How does wet bulb temperature affect cooling tower efficiency?
Wet-bulb temperature sets the theoretical lower limit of cooling. As wet-bulb temperature rises—typically during humid summer months—the approach value increases, and efficiency decreases. Operators must account for seasonal wet-bulb variation when evaluating performance data.
How can airflow design improve cooling tower efficiency?
Proper airflow design ensures that air moves evenly through the fill media, maximizing the contact time between air and water. Improving duct configurations, correcting fan placement, and clearing obstructions at air inlets can significantly reduce approach temperature and raise efficiency.
What causes poor cooling tower performance?
Common causes include fouled or damaged fill media, air recirculation, incorrect fan placement, inadequate water distribution, scaling on heat transfer surfaces, and high ambient wet-bulb temperatures. Regular inspection and preventive maintenance address the majority of these issues before they cause measurable efficiency loss.