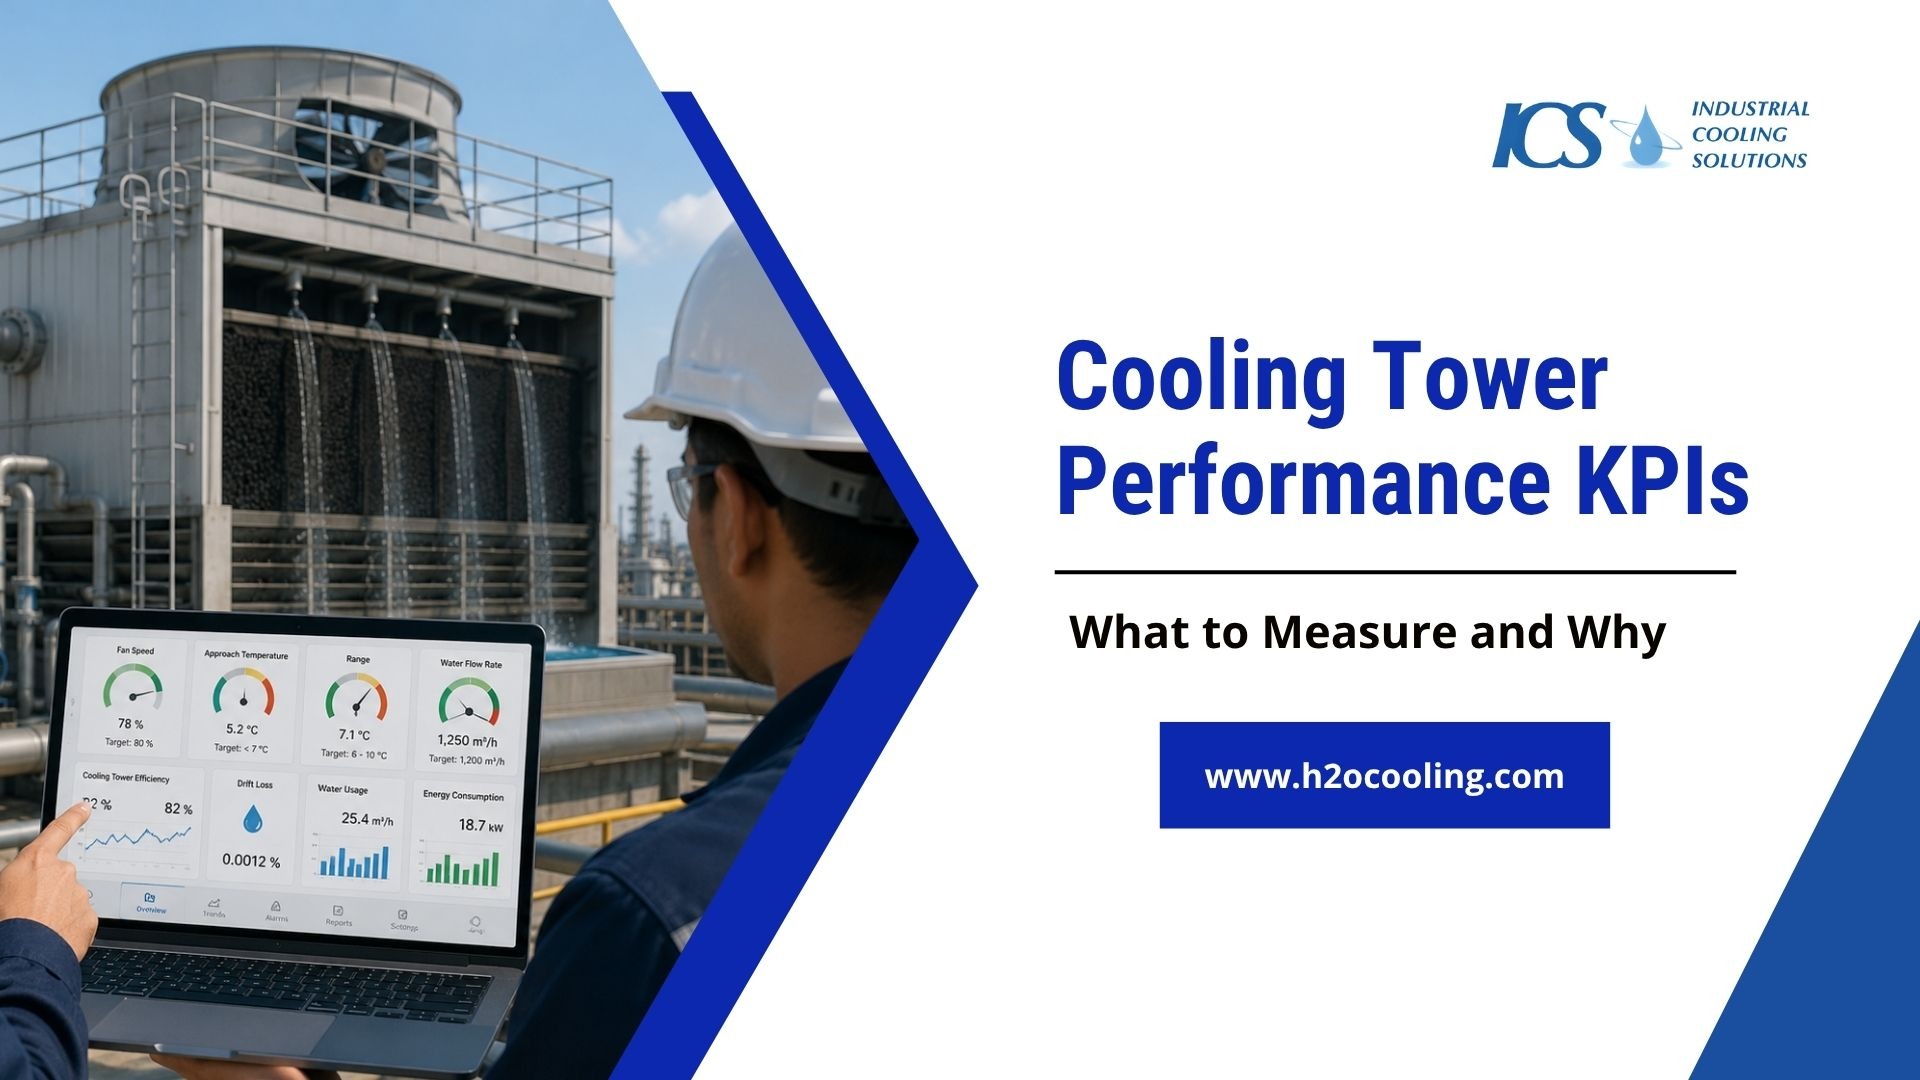
Tracking the right cooling tower performance KPIs helps operators improve efficiency, reduce energy waste, prevent system failures, and maintain stable thermal performance. Modern cooling tower management depends on monitoring critical performance metrics such as approach temperature, fan energy consumption, water usage, heat rejection efficiency, and system reliability.
Without measurable operational data, cooling towers gradually lose performance while increasing operating costs. The best United States facilities use KPI-driven monitoring to identify problems early, optimize maintenance schedules, improve water treatment programs, and maintain strong operational benchmarks across the entire cooling system.
Why Cooling Tower Performance Cannot Be Managed Without KPIs
Most Cooling Towers Lose Efficiency Gradually
Cooling systems do not usually fail overnight. Instead, performance degrades slowly over months or years due to invisible issues that operators easily miss. Tracking specific performance metrics reveals this hidden degradation before it impacts production.
The most common causes of gradual efficiency loss include:
- Scaling buildup: Mineral deposits reduce the heat transfer capabilities of the fill media.
- Fouling accumulation: Biological growth and suspended solids block proper water distribution.
- Airflow restriction: Damaged louvers or fan degradation reduce the total volume of cooling air.
- Poor water quality: Unmanaged chemistry accelerates corrosion and limits thermal efficiency.
Reactive Maintenance Costs More Than KPI Monitoring
Many industrial plants wait for a component failure before scheduling maintenance. This run-to-failure approach guarantees expensive emergency repairs and unplanned facility downtime. Monitoring mechanical indicators helps maintenance teams replace parts before catastrophic failures occur.
Facilities that ignore data face severe financial consequences:
- Higher repair costs: Emergency replacement parts cost significantly more than planned spares.
- Production losses: Unexpected cooling tower outages force the entire manufacturing process to stop.
- Safety hazards: Failing rotating equipment presents severe physical dangers to plant personnel.
What Cooling Tower Performance KPIs Actually Measure
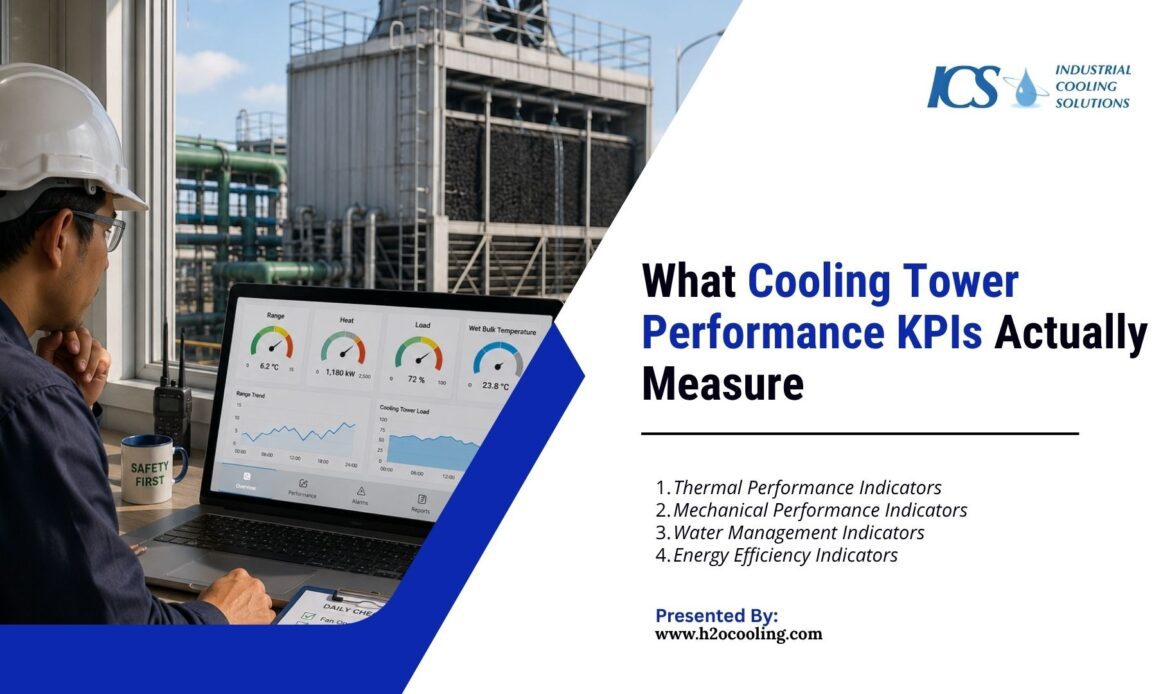
Thermal Performance Indicators
Thermal indicators are crucial cooling tower performance KPIs that measure how effectively the tower removes heat from the process water. By comparing actual cooling results against the equipment's original design specifications, these metrics can signal a drop in thermal efficiency, which almost always points to an internal physical problem.
Key thermal metrics to track include:
- Range: The temperature difference between the hot water entering and the cold water leaving.
- Heat load: The total amount of thermal energy the tower rejects into the atmosphere.
- Effectiveness: The ratio of the actual cooling range to the maximum theoretical cooling possible.
- Wet bulb correlation: How closely the system tracks changes in ambient humidity and temperature.
Mechanical Performance Indicators
Mechanical indicators monitor the physical health of the moving parts inside the cooling tower. The fans, motors, gearboxes, and pumps require constant surveillance to ensure safe operation. Changes in mechanical data usually point to physical wear or structural misalignment.
Essential mechanical metrics include:
- Motor load: The electrical current drawn by the fan motor during operation.
- Vibration velocity: The physical shaking of the drive shaft, gearbox, or motor housing.
- Bearing temperature: The operating heat generated by friction within the rotating assemblies.
- Oil level and quality: The condition of the lubricant protecting the mechanical gearbox.
Water Management Indicators
Water metrics track the efficiency of the evaporation process and the health of the internal chemistry. Since cooling towers consume massive volumes of water, even minor improvements in water efficiency save thousands of dollars.
Important water management metrics include:
- Makeup water volume: The total amount of fresh water added to replace evaporation.
- Blowdown rate: The volume of water intentionally drained to remove concentrated minerals.
- Evaporation rate: The calculated volume of water lost to the cooling process.
- Drift loss: The unintended loss of liquid water droplets escaping through the fan stack.
Energy Efficiency Indicators
Energy metrics, key cooling tower performance KPIs, reveal the electrical power required for cooling. Fans and pumps are major electricity consumers, so tracking their efficiency is crucial for managing operational costs and identifying opportunities to optimize variable frequency drives (VFDs).Approach Temperature: The Most Important Cooling Tower KPI
What Approach Temperature Actually Means
The approach temperature serves as the ultimate indicator of cooling tower health. It represents the temperature difference between the cold water leaving the basin and the ambient wet bulb temperature. A perfectly efficient tower would cool water exactly to the wet bulb temperature, resulting in an approach of zero.
Operators must understand these facts about the calculation:
- Theoretical limit: Physics prevents the cold water from ever dropping below the wet bulb temperature.
- Design specification: Every tower comes with a specific design approach based on its intended heat load.
- Standard formula: Calculate this metric using: \text{Approach Temperature} = T_{cold\ water} - T_{wet\ bulb}
- Continuous measurement: Weather changes constantly, so facilities must measure the wet bulb temperature dynamically.
Why Lower Approach Indicates Better Tower Performance
A smaller approach value is one of the key cooling tower performance KPIs, indicating that the fill media, airflow, and water distribution are working in harmony. Maintaining a low approach ensures your downstream processes receive adequately cooled water for maximum efficiency.
A stable, low approach provides these benefits:
- Maximum process efficiency: Chillers and heat exchangers consume less energy when receiving colder water.
- Optimal fill condition: A tight approach confirms the plastic fill media remains clean and unobstructed.
- Excellent airflow: The metric verifies the fan moves the correct volume of air through the water.
- Thermal stability: The plant experiences fewer temperature alarms during peak summer production hours.
Common Causes of High Approach Temperature
An increasing approach temperature always signals a degrading cooling tower. If the wet bulb temperature remains constant but the cold water temperature rises, the system has lost efficiency. Operators must investigate the physical components immediately when this metric creeps upward.
The most frequent culprits include:
- Fouled fill media: Algae, scale, or debris block the channels where air and water mix.
- Clogged spray nozzles: Blocked nozzles create dry spots in the fill, wasting potential cooling area.
- Poor fan performance: Incorrect blade pitch or slipping belts reduce the total cooling airflow.
- Hot air recirculation: The tower ingests its own warm exhaust air instead of fresh ambient air.
Recommended Operational Benchmarks for Approach Temperature
Every cooling tower has unique design parameters, but industry standards dictate acceptable performance ranges. Facility managers must compare their daily approach data against these standard operational benchmarks. Deviations of more than a few degrees warrant immediate physical inspection.
Standard benchmarks include:
- Comfort cooling (HVAC): Typical design approach ranges from 5°F to 7°F (2.7°C to 3.8°C).
- Industrial processes: Heavy industrial applications often design for a 7°F to 10°F (3.8°C to 5.5°C) approach.
- Power generation: Large field-erected towers usually operate with a 10°F to 15°F (5.5°C to 8.3°C) approach.
- Warning threshold: An increase of 2°F above the design specification requires maintenance intervention.
Energy Per Ton: Measuring Cooling Efficiency Correctly
Energy per ton helps operators understand how much electrical power the system uses for each ton of cooling delivered. This KPI connects performance with energy cost.
It becomes especially useful when facilities compare fan control, pump operation, and seasonal cooling demand.
What Energy Per Ton Measures
Operators calculate energy per ton with this formula:
Energy Per Ton = kW Consumption ÷ Cooling Tons
A lower value usually shows better efficiency. A higher value may show airflow problems, poor VFD control, fouled fill, or excessive fan operation. This KPI works best when teams measure it under similar operating conditions.
Why Fan Energy Consumption Matters
Cooling tower fans can waste energy when they run at full speed unnecessarily. Poor controls may overcool water during low load or run fans harder than needed during mild weather.
Fan control strategies affect total condenser water system power, including chillers, tower fans, and condenser water pumps. A 2022 study reviewed open-loop fan speed control and closed-loop approach temperature control to reduce total power use.
How Seasonal Conditions Affect Energy KPIs
Seasonal conditions like heat, humidity, and process load directly impact energy consumption. Winter or periods of low load naturally reduce cooling demand. When tracking cooling tower performance KPIs, operators should compare trends by season, as a summer energy per ton value will differ significantly from that of a mild winter day.
Target Operational Benchmarks for Energy Efficiency
Every facility should build its own benchmark from design data and historical performance. The best target depends on tower type, fan system, chiller plant, and process load.
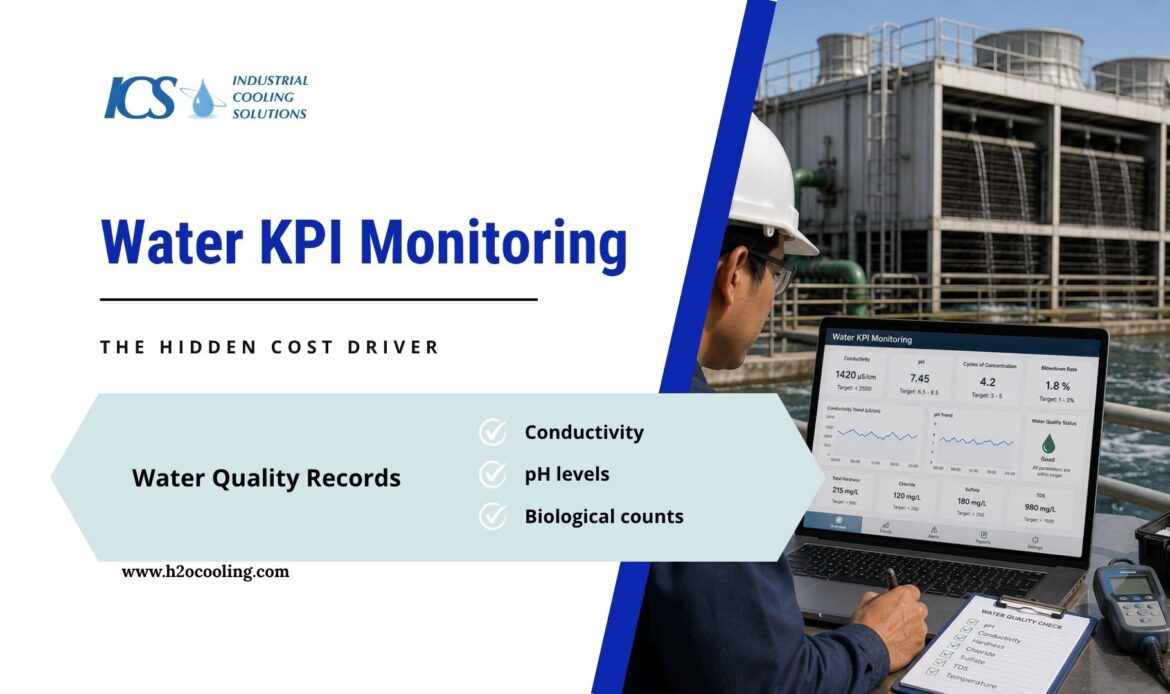
Water KPI Monitoring: The Hidden Cost Driver
Why Water Usage Is a Critical KPI
Industrial cooling towers consume millions of gallons of water, and with rising water rates and drought restrictions, inefficient usage can significantly impact your budget. That's why water usage is one of the most critical cooling tower performance KPIs to monitor.
Tracking a dedicated water KPI helps facilities identify leaks, overflow issues, and poor chemistry control.
Water monitoring prevents these costly scenarios:
- Undetected basin leaks: Cracked concrete or failing seals allow expensive treated water to drain away continuously.
- Faulty makeup valves: A broken mechanical float valve causes the basin to overflow straight into the sewer.
- Sewer surcharge fees: Municipalities charge industrial plants heavily for discharging excessive wastewater.
- Sustainability failures: Facilities miss their corporate environmental goals when they waste fresh water.
Cycles of Concentration and Water Efficiency
Cycles of concentration measure how concentrated dissolved solids become in the cooling water compared with makeup water. The EPA explains that the concentration ratio equals TDS or conductivity in blowdown divided by conductivity in makeup water.
Higher cycles can reduce water waste, but only if treatment controls scaling and corrosion.
The DOE notes that increasing cycles from three to six can reduce makeup water by 20% and blowdown by 50%.
Monitoring Drift and Evaporation Losses
Evaporation represents the necessary water loss required to reject heat, but drift represents pure waste. Drift consists of liquid water droplets pulled out of the tower exhaust by the fan. Measuring total water loss helps operators distinguish between productive evaporation and wasteful drift.
Understanding water loss components:
- Evaporation standard: Towers evaporate roughly 1.8 gallons per minute for every 100 tons of cooling load.
- Drift eliminator health: Broken or missing drift eliminators allow expensive, chemically treated water to escape.
- Environmental damage: Drift droplets carry treatment chemicals that damage surrounding vehicles, buildings, and vegetation.
- Windage loss: High winds blow water out of the air inlet louvers if the tower lacks proper shielding.
Water Quality Records Every Facility Should Track
Water chemistry directly dictates the lifespan of the metal and plastic components inside the cooling system. Digital sensors make tracking these water quality metrics easier than ever before.
Essential chemistry records include:
- Conductivity: Measures total dissolved solids to control the automated blowdown process.
- pH levels: Tracks the acidity or alkalinity of the water to prevent rapid metal corrosion.
- Biological counts: Monitors the presence of dangerous bacteria, including Legionella, to ensure safe operation.
- Inhibitor levels: Verifies that the correct concentration of anti-scaling chemicals remains active in the system.
Essential Cooling Tower Performance KPIs
This quick reference guide outlines essential cooling tower performance KPIs for your monitoring program. Integrating these metrics into daily inspections ensures a balanced approach to thermal, mechanical, and water management.
| KPI | What It Measures | Target Benchmark | Warning Sign | Action Required |
| Approach Temperature | Thermal heat transfer efficiency | Within 2°F of design | Consistently rising approach | Inspect fill media for fouling |
| Energy Per Ton | Total electrical efficiency | 0.03 - 0.08 kW/ton | High kW usage | Check VFD settings & fan pitch |
| Cycles of Concentration | Water conservation efficiency | 3 to 5 cycles minimum | Excess makeup water usage | Calibrate conductivity controller |
| Fan Motor Current | Mechanical system load | Below motor FLA | Overcurrent or severe undercurrent | Check gearbox and drive belts |
| Vibration Velocity | Rotating equipment health | Below 0.15 in/sec (IPS) | Rising imbalance trend | Schedule laser alignment |
Integrating this table into plant standard operating procedures gives operators clear guidance on how to react to changing data.
Conclusion
Cooling tower performance KPIs help facilities maintain energy efficiency, water conservation, equipment reliability, and stable thermal performance. Operators cannot manage cooling tower health by watching cold water temperature alone. They need performance metrics like approach temperature, energy per ton, fan motor current, vibration, cycles of concentration, and water KPI data to find problems early.
Facilities that use KPI-driven monitoring and clear operational benchmarks reduce operating costs, improve preventive maintenance, prevent avoidable failures, and extend cooling tower equipment life. The best programs record daily readings, review trends weekly, compare seasonal benchmarks, and use data to guide real maintenance action.
Frequently Asked Questions
What are cooling tower performance KPIs?
Cooling tower performance KPIs are measurable values that show how efficiently and reliably a cooling tower operates. They include approach temperature, range, energy per ton, water consumption, cycles of concentration, fan motor current, vibration, and uptime. These KPIs help operators detect fouling, airflow problems, water treatment issues, and mechanical wear before major failures occur.
Why is approach temperature important?
Approach temperature shows the difference between cold water temperature and wet bulb temperature. It helps operators judge how closely the tower performs to its evaporative cooling potential. A rising approach often points toward fouled fill, poor airflow, nozzle blockage, low water flow, or recirculation. This makes it one of the most useful cooling tower KPIs.
How do you calculate energy per ton?
Calculate energy per ton by dividing total kW consumption by cooling tons delivered. This KPI helps operators compare power use with actual cooling output. A high value may show poor fan control, fouled fill, pump inefficiency, or excessive energy use. Facilities should compare this metric under similar load and weather conditions.
What water KPIs should cooling towers track?
Important water KPI values include makeup water, blowdown volume, conductivity, pH, TDS, cycles of concentration, drift observations, and chemical residuals. These metrics help operators control water use, reduce scaling, prevent corrosion, and manage treatment performance. They also support sustainability and cost control.
How often should operators review cooling tower KPIs?
Operators should record critical KPIs daily and review short-term trends weekly. Maintenance and engineering teams should complete deeper monthly reviews to compare seasonal performance, energy use, water consumption, and reliability. Real-time systems can trigger alarms immediately when critical readings move outside safe limits.
What causes cooling tower KPIs to decline?
Cooling tower KPIs decline when fill becomes fouled, nozzles clog, airflow drops, fan systems wear, water chemistry drifts, or heat load changes. Poor maintenance and weak monitoring allow these issues to worsen. Trend analysis helps teams identify the cause before the system loses major efficiency.